


Rhisco Blog
Es común que al decidir una estrategia para almacenar datos se use una base de datos relacional, lo cual es una muy buena solución... A menos que el volumen de datos sea de millones de registros, o las consultas requieran obtener información de diferentes tablas a la vez, o los datos a guardar sean no estructurados; una alternativa sería optar por una solución NoSQL, que surgieron como respuesta a estas y otras problemáticas.
Pero existen otros casos donde quisiéramos aprovechar las bondades de una base relacional sin las restricciones de un esquema y sin la complejidad de un lenguaje de consulta relacional. En esta situación podríamos hacer uso de grafos.
Pero antes de avanzar, ¿Qué es un grafo?
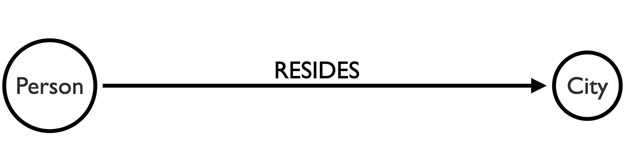
Un grafo en términos simples se compone de un nodo y una relación. Un nodo puede representar una entidad (persona, dirección, evento) y la relación representaría cómo estos nodos están asociados entre sí. Esto nos permite representar diversas situaciones, por ejemplo:

En esta imagen (también referido como "grafo") observamos dos nodos unidos por una relación; las entidades son Persona y Ciudad, estas entidades pueden tener diferentes características que pueden ser representados en el nodo como propiedades, por ejemplo: nombre, edad, teléfono, etc. La relación une estas dos entidades, describiendo que la persona X vive en la ciudad Y.

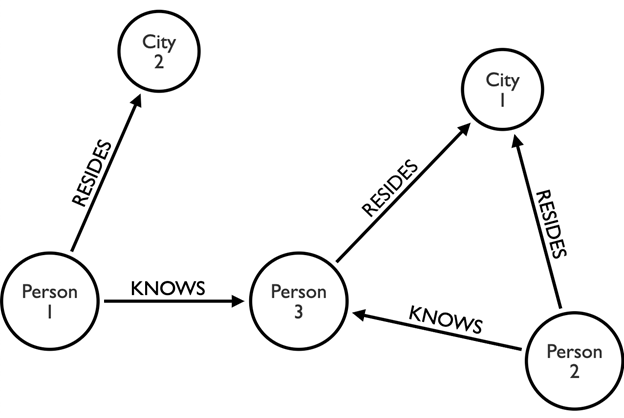
En este otro grafo tenemos diferentes instancias de personas y ciudades, podemos ver cómo se relacionan entre sí, obtener este resultado a través de una consulta relacional implica hacer una operación "join" a diferencia de usar un lenguaje de consulta para grafos, donde solo necesita indicar la relación que une las entidades.
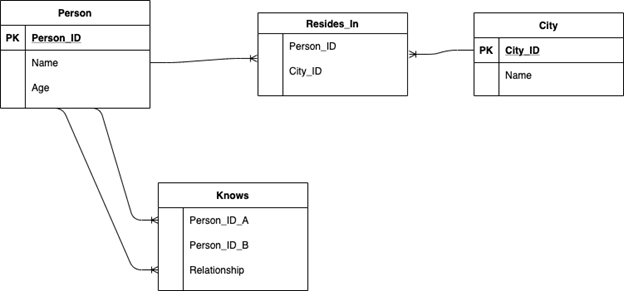
Sabiendo esto, hagamos un ejercicio de pasar un modelo relacional a un grafo, supongamos que queremos guardar registros de personas, en donde residen actualmente y si estas personas tienen una relación de parentesco o amistad. Entonces, podemos representar este caso en el siguiente diagrama:
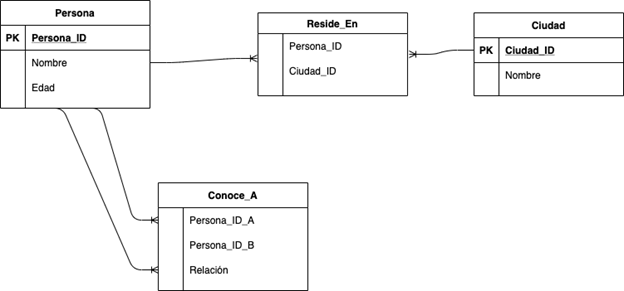
Podemos observar de las tablas que tenemos dos entidades:
Persona y Ciudad, cada una con propiedades que denota una característica de la entidad, además de estas tenemos otras dos tablas intermedias que representan cómo están relacionadas estas entidades. Revisemos cada una:
Reside_En: Esta tabla intermedia representa en qué ciudad vive una persona. Una ciudad puede tener miles de habitantes y una persona puede residir en diferentes ciudades a lo largo de su vida, de esta forma podemos tener tantos registros como se requieran.
Conoce_A: Esta tabla contiene la información de cómo una persona se relaciona con otra. Por ejemplo: La Persona A conoce a la Persona B y tienen una relación de Padre.
Dado este ejemplo podemos observar que requerimos de cuatro tablas para este sencillo caso.
Ahora pasemos este modelo a un grafo. Como decía al principio, un nodo puede ser una entidad como Persona y Ciudad, aunque no es una regla, un nodo también podría ser una "llamada". Por ejemplo, dependiendo del caso de uso, tener un evento como una llamada puede ser útil si requerimos hacer consultas relevantes, por ejemplo, cuál es el tiempo promedio de una llamada entre dos personas.
Las tablas intermedias en este caso representan una relación entre las entidades por lo que podríamos usarlas como relaciones en un grafo.
El resultado del modelo relacional hacia un grafo sería como sigue:

Como observamos, el nodo Persona y el nodo Ciudad representan las tablas en el modelo relacional. Cada nodo tiene sus respectivas propiedades, las tablas intermedias ahora son relaciones que igualmente tienen sus propiedades. Comparándolos de manera gráfica es mas fácil entender este grafo contra el diagrama relacional y la representación se siente mas natural.
Finalmente, para terminar esta introducción, podemos resumir que un modelo relacional es una solución robusta para la mayoría de escenarios. Sin embargo, existen casos en donde utilizar un modelo de grafos puede reducir la complejidad de las consultas y eliminar las restricciones de un esquema, sin perder las ventajas de una base de datos relacional.
En la siguiente publicación de esta serie revisaremos cómo crear este modelo en una base de datos de grafos: Neo4j, utilizando el lenguaje de consulta cypher y revisaremos cómo cambia el paradigma de usar un lenguaje de consulta estructurado a uno no estructurado
Graphs vs relational databases
It is common for a relational database to be used when deciding on a strategy to store data, which is a very good solution unless the volume of data is millions of records, or the queries need to obtain information from different tables at once, or the data to be saved are unstructured; a serious alternative would be to opt for a NoSQL solution, which arose in response to these and other problems. But there are other cases where we could take advantage of the benefits of a relational database without the constraints of a schema and without the complexity of a structured query language, in this situation we could make use of graphs.
But before we move on, what is a graph?
A simple graph consists of a node and a relationship. A node can represent an entity (person, address, event) and the relationship would represent how these nodes are associated with each other. This allows us to represent various situations, for example:
In this image you see two nodes joined by a relationship, the entities are Person and City, these entities can have different characteristics that can be represented in the node as properties, for example: name, age, phone, etc. The relationship resides between these two entities, describing that person X lives in city Y.
In this other graph we have different instances of people and cities, we can see how they relate to each other, getting this result through a relational query involves doing a join operation as well as using a query language for graphs, where you only need to indicate the relationship that joins the entities.
Knowing this, let's do an exercise of mapping a relational model to a graph, suppose we want to keep records of people, where they currently live in and if these people have a kinship or friendship, we can represent this case in the following diagram:
We can see from the tables that we have two entities:
Person and City, each with properties denoting a feature of the entity, and besides these two we have two other intermediate tables that represent how these entities are related. Let's review each one:
Reside_En: This middle table represents in which city a person lives; a city can have thousands of inhabitants and a person can live in different cities throughout their life, so we can have as many records as required.
Conoce_A: This table contains information about how one person relates to another, for example: Person A knows Person B and they have a Parent relationship.
Given this example we can see that we require four tables for this simple case.
Now let's pass this model to graph. As I said at the beginning, a node can be an entity like a Person and City, although it is not a rule, a node could also be a Call. For example, depending on the use case, having an event as a call can be useful if we require to make associated queries, for example, what is the average length of a call between two people?
The intermediate tables in this case represent a relationship between the entities so we could use them as relationships in a network.
The result of the relational model towards a graph would look like this:
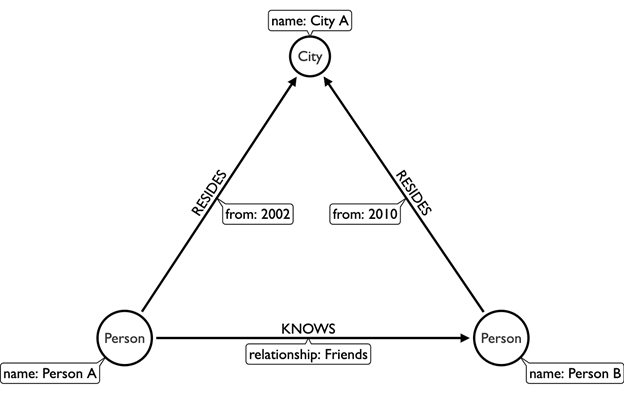
As we observe the Person node and the City node represent the tables in the relational model, each node has their respective properties, the intermediate tables are now relationships that also have their properties. It is easier to understand this graph when we compare it against the relational diagram so the representation feels more natural.
Finally, to finish this introduction, we can summarise that a relational model is a robust solution for most scenarios, however, there are cases where using a graph model can reduce query complexity and remove constraints from a schema, without losing the benefits of a relational database.
In the following post of this blog serie we will review how to create this model in a graph database: Neo4j, using the cypher query language and will review how the paradigm changes from using a structured query language to an unstructured query language.
About Rhisco
In Rhisco we are a specialised company and, as a single team and with passion for what we do, we collaborate with our clients to design and implement fit-for-purpose solutions to address their strategic objectives on productivity, profitability, integrated risk management, compliance, and competitiveness.
Our purpose is to transform day to day life at work and at home by promoting industry best practices, ethical behavior and sustainable businesses through technology, design thinking, innovation, and positive influence in society.
About allgood.ai – service for monitoring regulation and manage regulatory change based on artificial intelligence
Our platform allgood.ai™ allows rapid and easy consultation of regulations, its interdependencies and obligations, and management of regulatory change in a collaborative way, among other functionality. We use innovative technology, including artificial intelligence and graph databases. Visit our platform to learn more.